
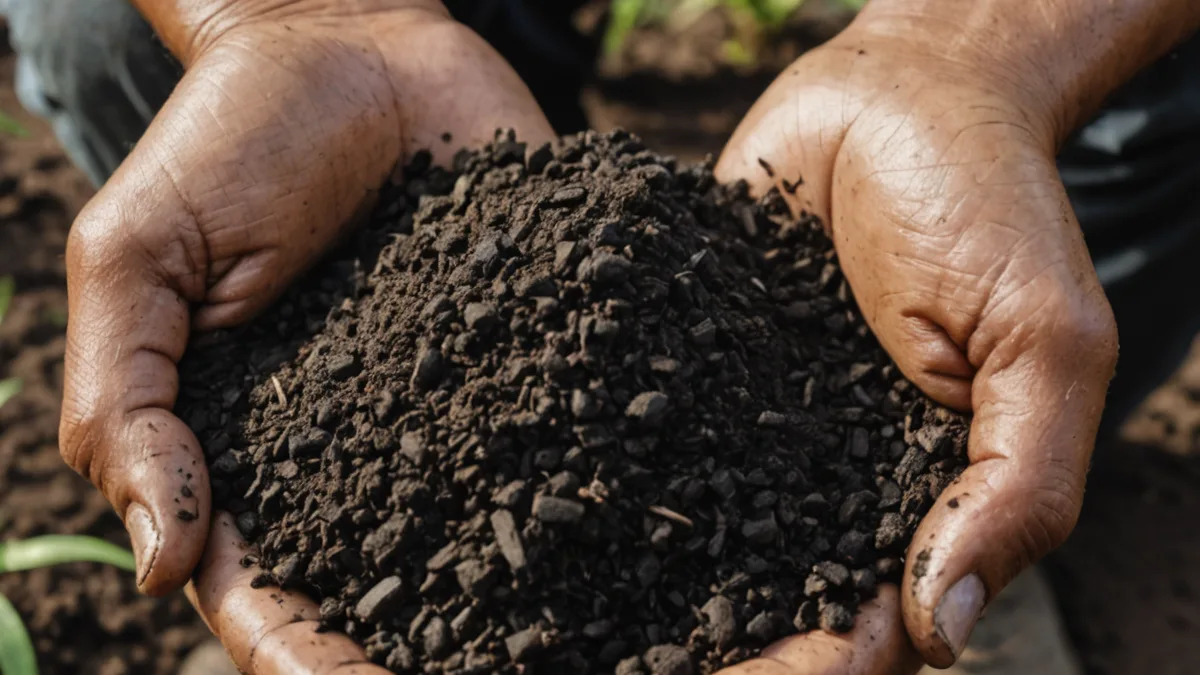
Soil type variance is West Java's biggest agronomic variable
In West Java's Priangan highlands, a Cianjur farmer planting Ciherang rice on Andosol volcanic soil is making a completely different set of decisions than a farmer in Subang's alluvial lowlands, even if both are following the same fertilizer guidance from their local input dealer. The national recommended dose for urea on rice, roughly 200 to 250 kg per hectare, does not account for the nitrogen-holding capacity difference between a well-structured Andosol and a compacted Latosol that has been double-cropped for fifteen years.
This variance is not new. Indonesian agronomy extension programs have known about plot-level soil heterogeneity for decades. The challenge has been that measuring it at a meaningful scale required either expensive soil labs or a field agronomist with the time to test every plot. For smallholders farming 0.5 to 1.5 hectare plots, neither option was practical.
What the Elevarm model reads from each plot
We do not put sensors in every plot. That is not realistic for smallholder contexts and does not scale to thousands of farmers spread across multiple regencies. Instead, we combine three data layers that together narrow the uncertainty considerably.
The first layer is soil-class mapping. West Java's agricultural geology has been surveyed at the regency level, and we have built a soil-class grid that assigns each plot a baseline soil type based on location. This is not a substitute for a physical soil test, but it gives us a starting hypothesis: this plot is likely Andosol, likely Latosol, or likely alluvial. That classification alone changes the nitrogen and phosphorus baseline assumption.
The second layer is historical yield and input data from farmers who have enrolled their plots. After one or two seasons with a farmer, we can observe whether a given variety performed above or below the baseline for its soil class, and whether the applied fertilizer dose correlated with a yield response. This is observational inference, not controlled trial data, but it narrows the uncertainty between the soil-class prior and the specific plot reality.
The third layer is rainfall index data at the regency level. Nitrogen loss from over-saturated paddy soils follows predictable patterns relative to rainfall timing. If a farmer applied urea two weeks before a heavy rainfall event, a meaningful portion of that nitrogen leached before uptake. Our model flags whether the timing of an application window was favorable or risky based on rainfall history for that subdistrict.
How this changes the input decision before planting
The practical output is a fertilizer recommendation that differs by plot, not just by crop. A farmer in Subang with an alluvial plot that has been double-cropped for more than five seasons will get a different urea dose recommendation than a farmer on a fresh volcanic soil profile in Cianjur, even if both are planting the same variety in the same week.
The value to the farmer is not precision for its own sake. It is cost. Fertilizer is the single largest cash outlay in a rice planting season for most smallholders. A recommendation that says "you need 175 kg/ha, not 225 kg/ha" translates directly to input savings that the farmer captures, not the dealer.
The value to the dealer is different. Dealers who give accurate, personalized advice build trust that generic recommendations cannot. Farmers who receive a recommendation that costs less and yields well return to the same source the next season. The Mitra dealer network we have built operates on this principle: useful advice is a better retention mechanism than price discounts.
Where the model has limits
We are not claiming that our soil-class mapping eliminates the need for physical soil testing. It does not. If a farmer has a plot that has received an unusual management history, such as land recently converted from a fishpond or that has high sulfur from drainage problems, our baseline classification will be wrong in ways that a field test would immediately reveal.
What we can say is that for the majority of plots in the regencies we cover, the baseline classification is accurate enough to materially improve the input recommendation compared to the generic national average. There will be exceptions, and we try to flag them: when a farmer's self-reported yield history is very far below what we would expect for their soil class and variety, we surface a note that a physical soil test would be worth considering before the next planting season.
What we are building toward for the next planting cycles
The soil model improves with every season of yield data. As more farmers complete full planting cycles on the platform, we accumulate the observational data to refine both the soil-class priors and the variety-by-soil performance estimates. We are also working on integrating NDVI-based greenness signals from satellite imagery to add a fourth data layer, which will let us flag crop stress events in real time during the growing period.
For now, the most important impact of the soil health layer is the one that happens before planting. Knowing what your field likely needs before you walk into the input shop is still a significant improvement over guessing at the counter and hoping the dealer's advice matches your plot, not the last farmer who asked.